
The Global Slavery Index 2018
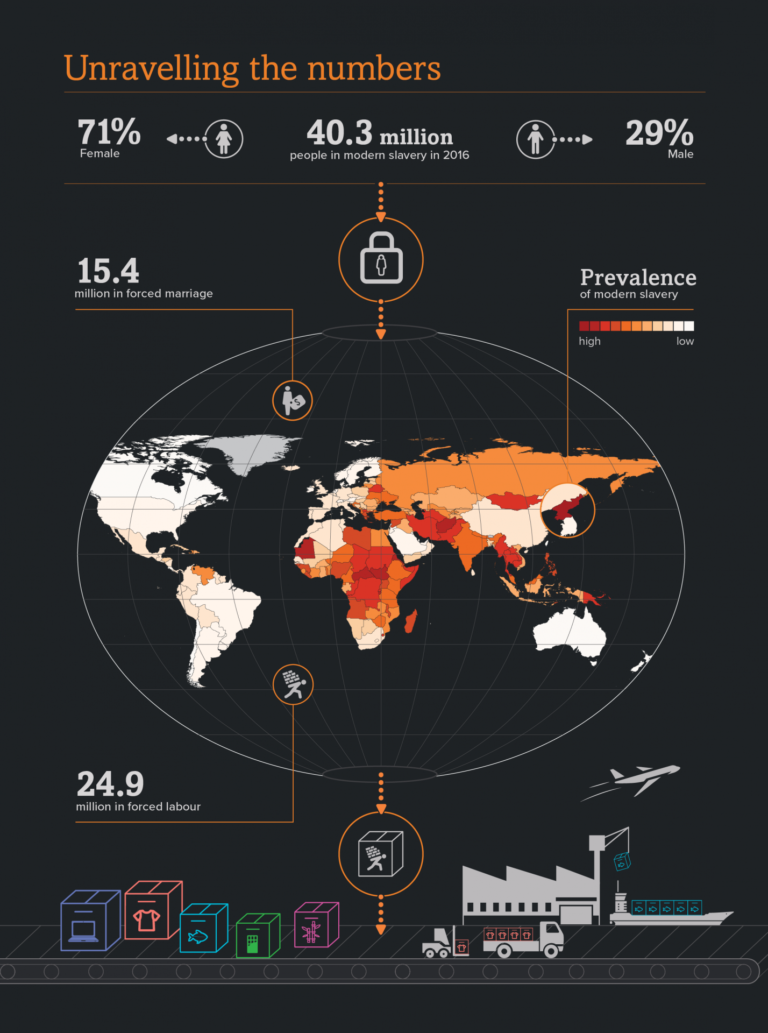
Executive Summary Depriving someone of their freedom is a terrible violation. Modern slavery is a destructive, personal crime and an abuse of human rights. It is a widespread and profitable criminal industry but despite this it is largely invisible, in...


