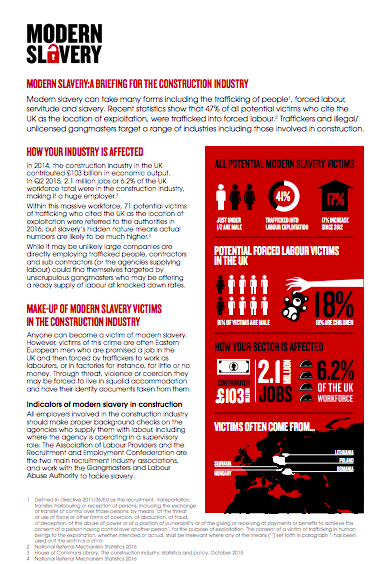
Modern slavery can take many forms including the trafficking of people, forced labour, servitude and slavery. Recent statistics show that 47% of all potential victims who cite the UK as the location of exploitation, were trafficked into forced labour. Traffickers and illegal/ unlicensed gangmasters target a range of industries including those involved in construction.

In 2014, the construction industry in the UK contributed £103 billion in economic output. In Q2 2015, 2.1 million jobs or 6.2% of the UK workforce total were in the construction industry, making it a huge employer.Within this massive workforce, 71 potential victims of trafficking who cited the UK as the location of exploitation were referred to the authorities in 2016, but slavery’s hidden nature means actual numbers are likely to be much higher. While it may be unlikely large companies are directly employing trafficked people, contractors and sub contractors (or the agencies supplying labour) could find themselves targeted by unscrupulous gangmasters who may be offering a ready supply of labour at knocked down rates.

Construction industry factsheet, Modern Slavery: A Briefing For the Construction Sector DOWNLOAD

post

page

attachment

revision

nav_menu_item

custom_css

customize_changeset

oembed_cache

user_request

wp_block

acf-field-group

acf-field

ai1ec_event

National Hotline 2017 Iowa State Report
Graphics & InfographicsPublications

The data in this report represents signals and cases from January 1, 2017 through December 31, 2017 and is accurate as of July 11, 2018. Cases of trafficking may be ongoing or new information may be revealed to the National Hotline over time. Conseq...Read More

National Hotline 2019 Hawaii State Report
Graphics & InfographicsPublications

The data in this report represents signals and cases from January 1, 2019 through December 31, 2019 and is accurate as of July 30, 2020. Cases of trafficking may be ongoing or new information may revealed to the National Hotline over time. Consequen...Read More

National Hotline 2018 Idaho State Report
Graphics & InfographicsPublications

The data in this report represents signals and cases from January 1, 2018 through December 31, 2018 and is accurate as of July 25, 2019. Cases of trafficking may be ongoing or new information may revealed to the National Hotline over time. Consequen...Read More

National Hotline 2017 Virginia State Report
Graphics & InfographicsPublications

The data in this report represents signals and cases from January 1, 2017 through December 31, 2017 and is accurate as of July 11, 2018. Cases of trafficking may be ongoing or new information may be revealed to the National Hotline over time. Conseq...Read More